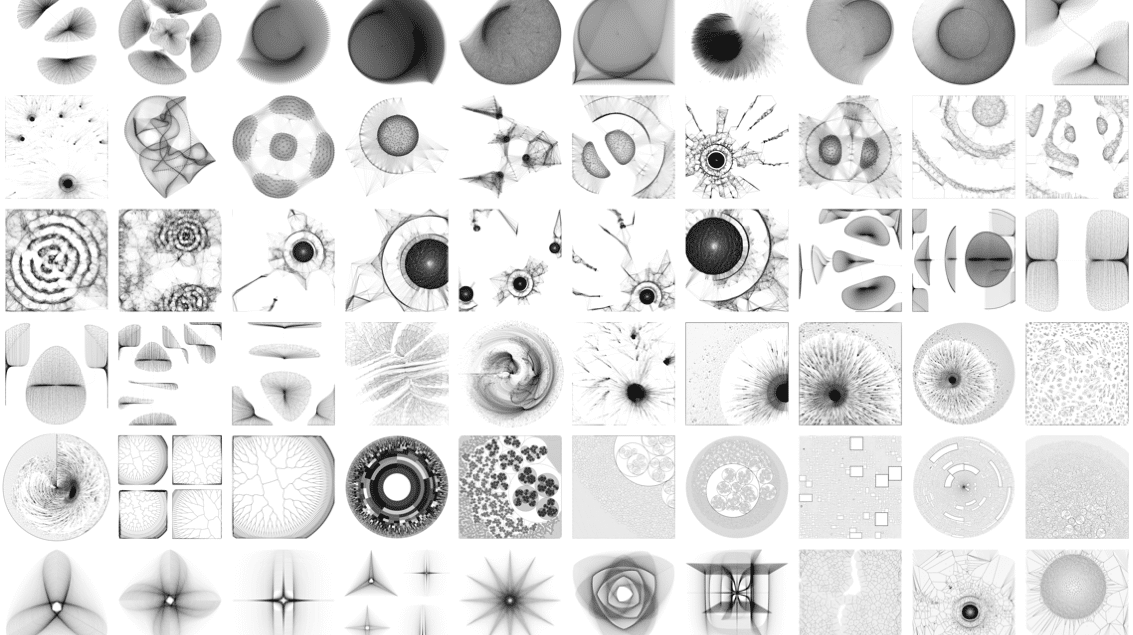
Graph art: 100 artistic graph visualizations created with R
Graph art: 100 artistic graph visualizations created with R
This is a collage of 100 graph-based plots. I published one plot per day for 100 consecutive days. The idea was to explore a range of graph / network visualization and analysis tools in R, and to produce a creative output using these tools each day.

Tools
The plots were created with R using the RStudio IDE. The main R packages that I used are briefly described below.
- igraph is an engine for network visualization and analysis. It provides functions for generating, manipulating and analysing graphs, and implements a variety of layout algorithms for positioning nodes in the plane.
- tidygraph provides a tidy API for graph analysis. A graph can be represented as tbl_graph object, which consists of two tidy data frames (one for nodes and one for edges). This makes it possible to apply piped sequences of operations to a graph, switching between the node and edge data as required.
- ggraph is a ggplot2 extension for graphs, which makes it possible to create ggplot2 visualizations from tbl_graph objects. It provides a suite of graph-specific geoms for nodes and edges, and also provides an interface to a variety of graph layout algorithms.
- graphlayouts provides additional layout algorithms that are not available in other packages.


Graph data generation
igraph provides a variety of functions for generating / simulating graph data, and tidygraph provides an interface to these functions. Some of the functions that I used to generate graph data include:
- Barabasi-Albert preferential attachment model – igraph
- Forest Fire network model – igraph
- Erdos Renyi model – igraph
- Notable graphs – igraph
In some cases I contrived new graphs, or created functions to augment or modify existing graphs.


Layout algorithms
There are several packages that provide algorithms for laying out graphs in the plane, including igraph, ggraph and graphlayouts. Some of the layout algorithms that I explored include:
- Fruchterman-Reingold – igraph
- Stress Majorization – graphlayouts
- Dendrogram – ggraph
- Circle packing – ggraph


The plots
Larger images and details for each plot can be found in the gallery below.


