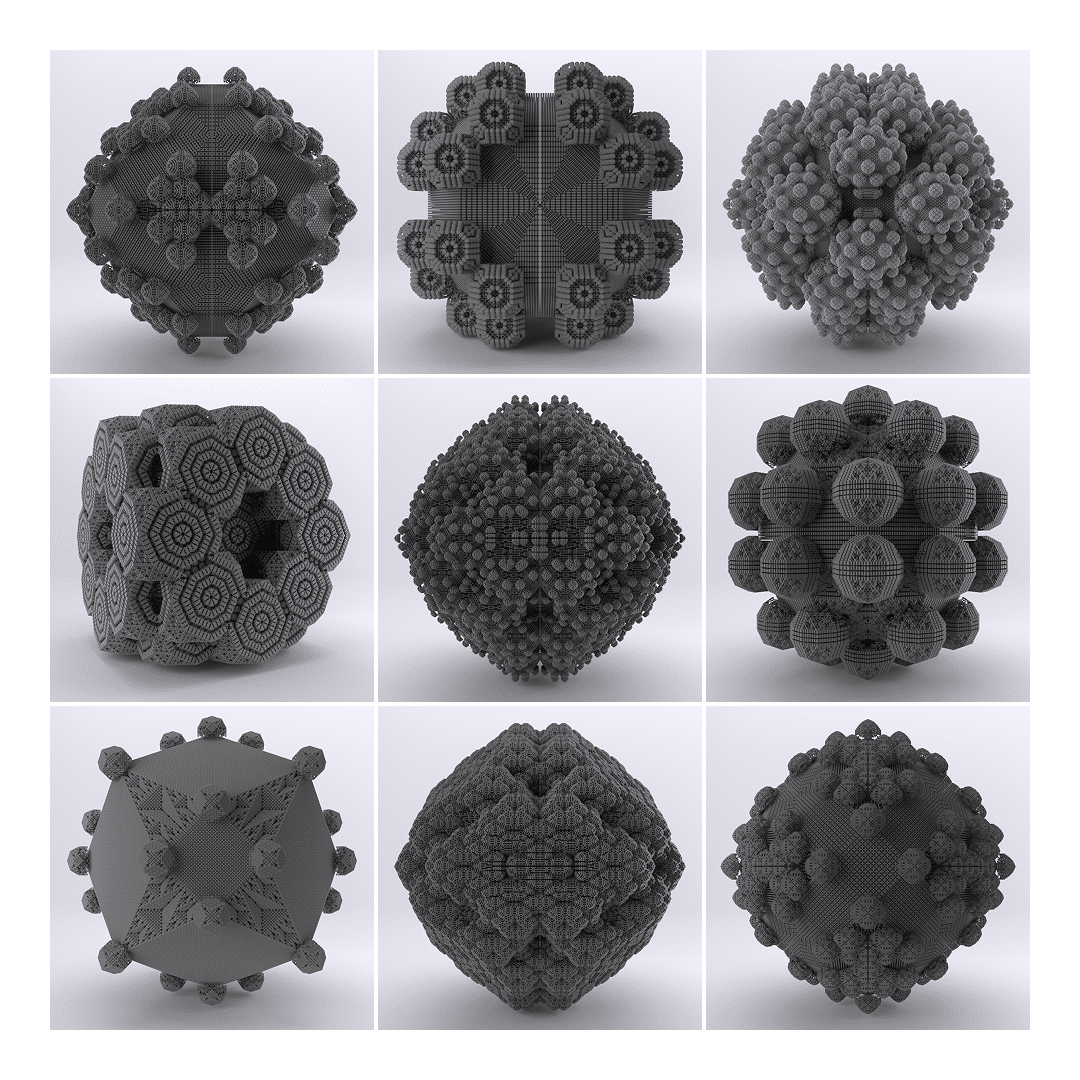
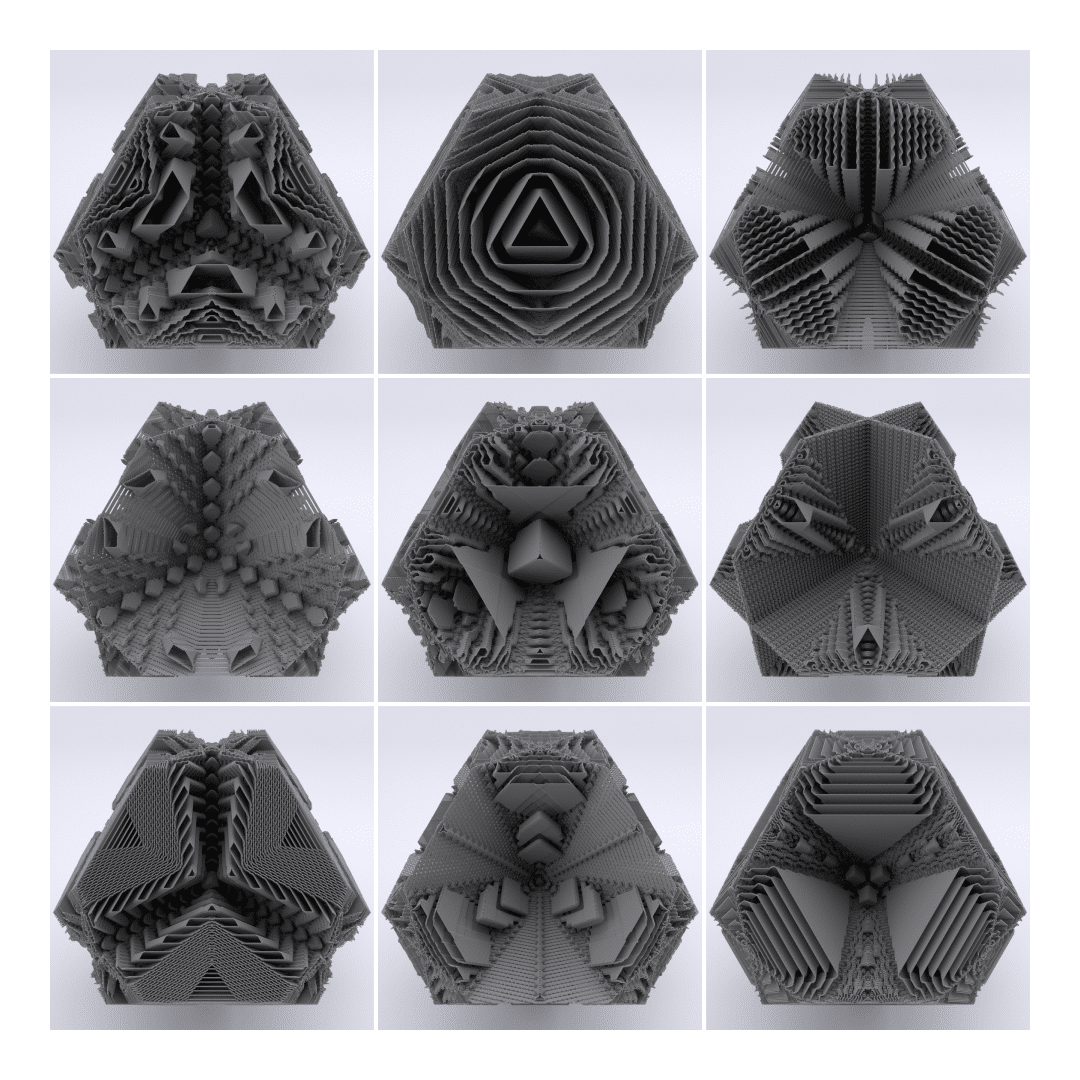
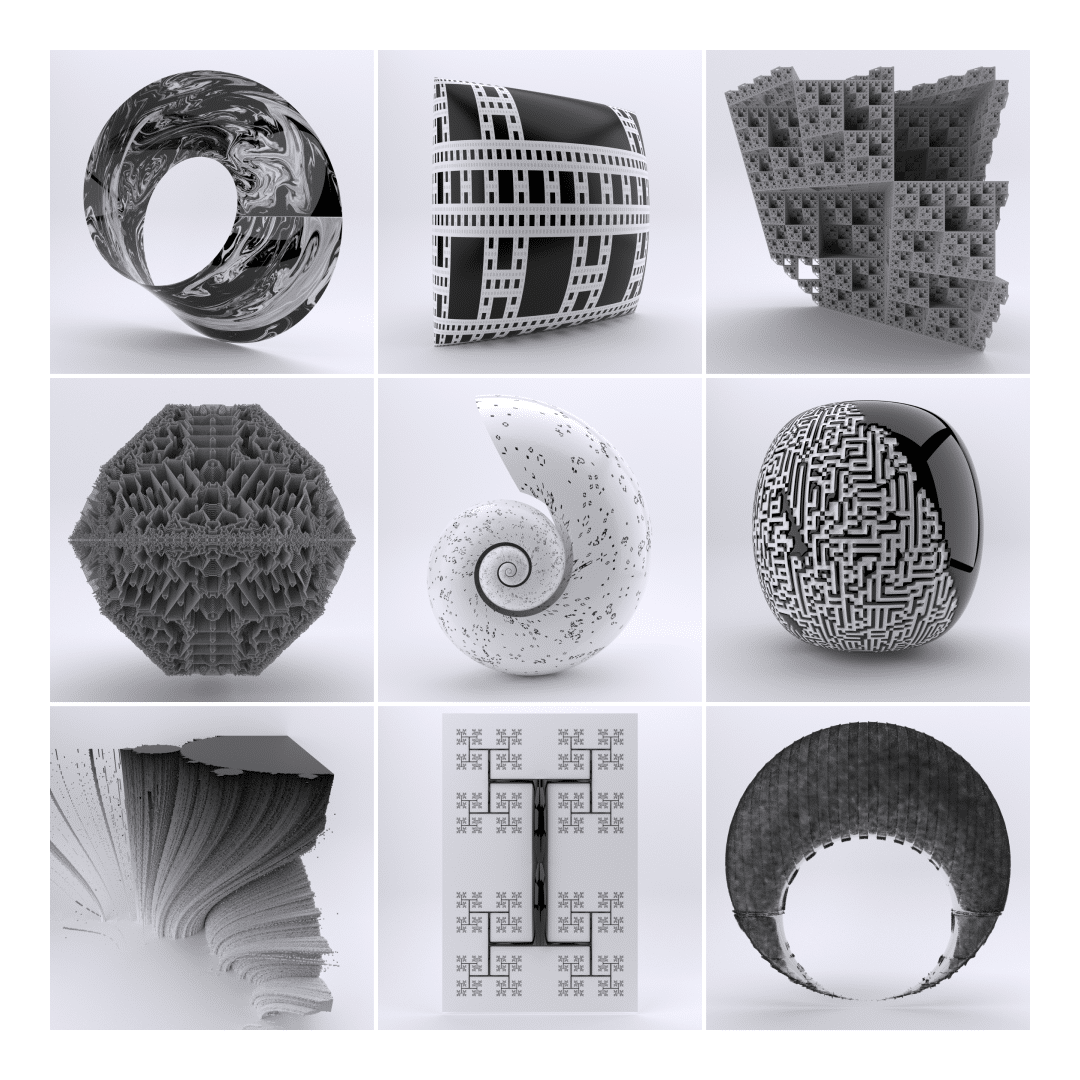
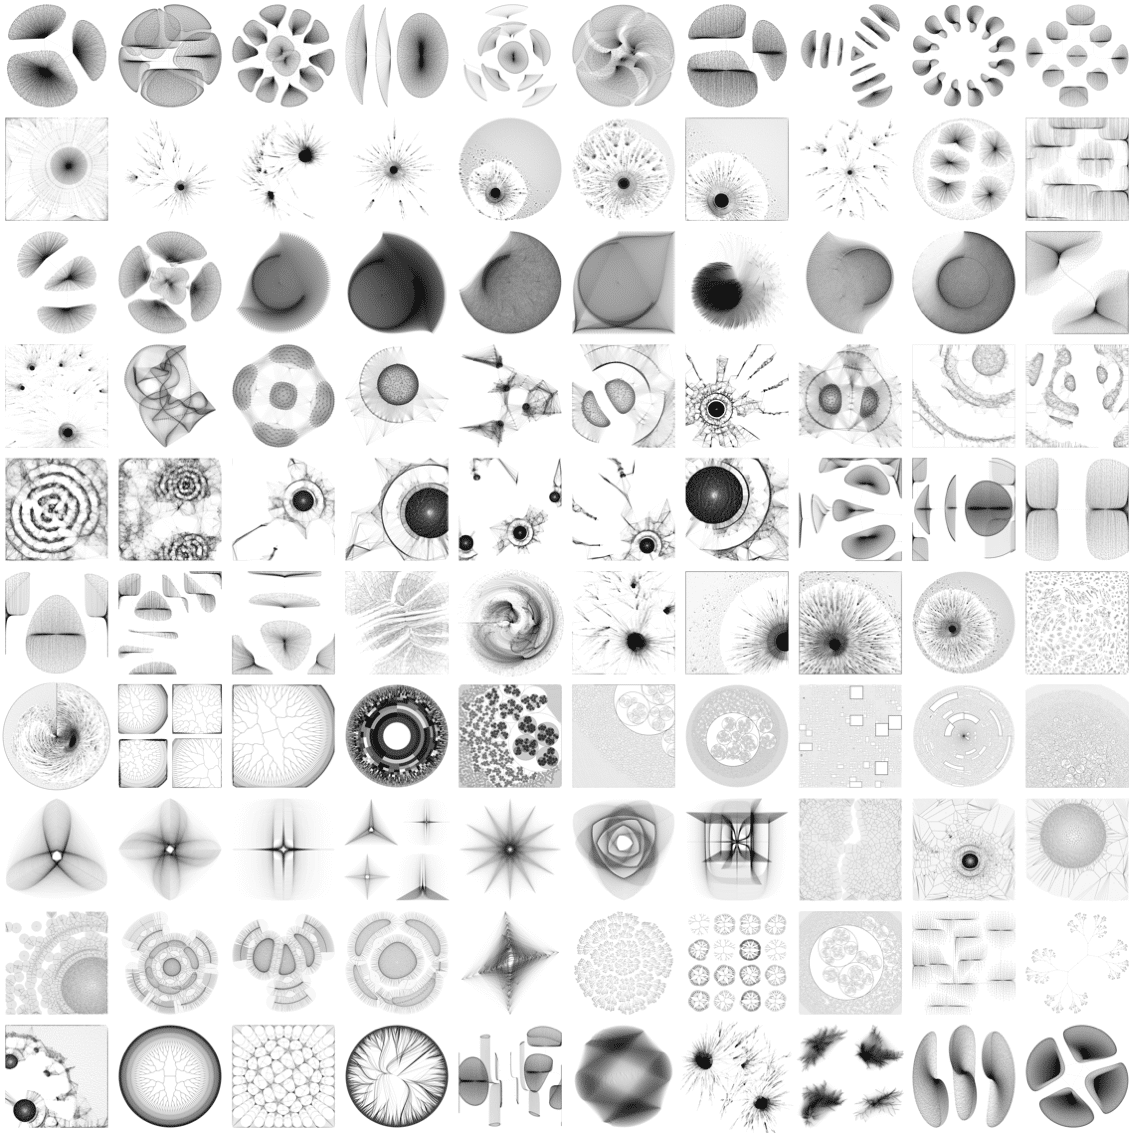
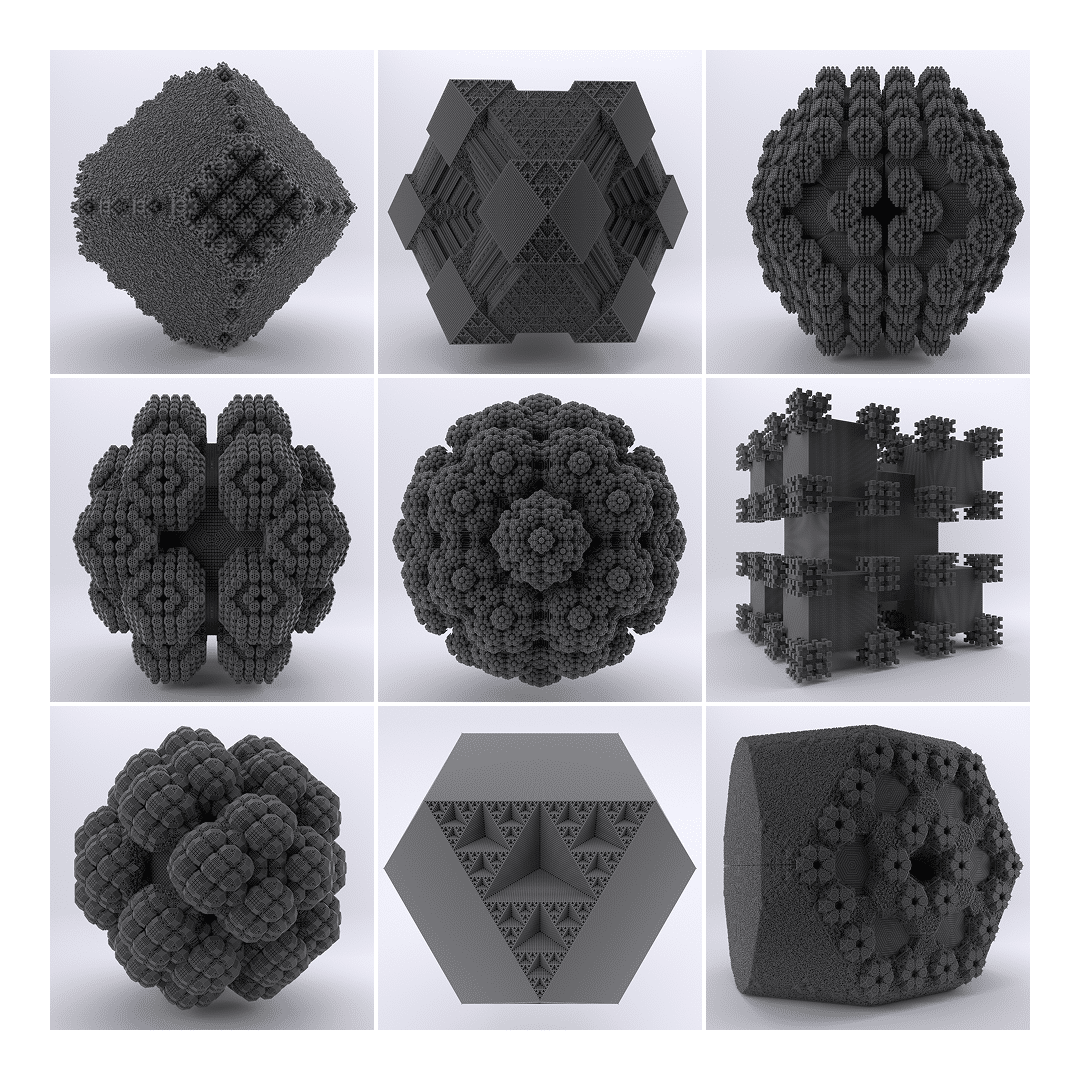
Loading posts...
  • Vector Flow Field Generative Art

    The following is a gallery of generative art created by tracing particle trajectories across vector flow fields. Some of the images were created using Python / Matplotlib, some with R / ggplot2 and some with Houdini / VEX. The images were created in 2021-2023.

  • Miscellaneous Data Visualizations 2016-2020

    The following is a gallery of miscellaneous data visualizations created with R and ggplot2 over the period 2016-2020.

  • Graph art: 100 artistic graph visualizations created with R

    Graph art: 100 artistic graph visualizations created with R This is a collage of 100 graph-based plots. I published one plot per day for 100 consecutive days. The idea was to explore a range of graph / network visualization and analysis tools in R, and to produce a creative output using these tools each day.…

  • strava: Create artistic visualisations with your exercise data in R

    The plots in this gallery have been generated in R from my Strava running data. I have incorporated the code behind most of these plots into an R package called strava, which is available on GitHub (https://github.com/marcusvolz/strava). Instructions for using the package are provided in the README, and Lidia Contreras has also written an instructional blog…
  • Artistic visualisations of mollusc shells

    The following are visualisations of mollusc shells, all of which have been created from the mathematical model described in Models for mollusc shell shape by Michael B. Cortie (1989). Lyria Turritella Hypothetical A Natalina cafra Conus Avocado (contrived) Heart (contrived) Nautilus Plant (contrived)